Mangrove Wave Testing
My teammates and I tested how different arrangements of model mangroves affected wave height in a laboratory tank.
The experiment
We used a gravity-powered wave generator to send waves through different barrier arrangements, then compared the measurements with a test without mangroves.
I fabricated the polycarbonate mounts and helped make aluminum parts for the wave generator. I also helped run the tests and analyzed the recorded trials using Tracker and Excel.
Setting up the barriers
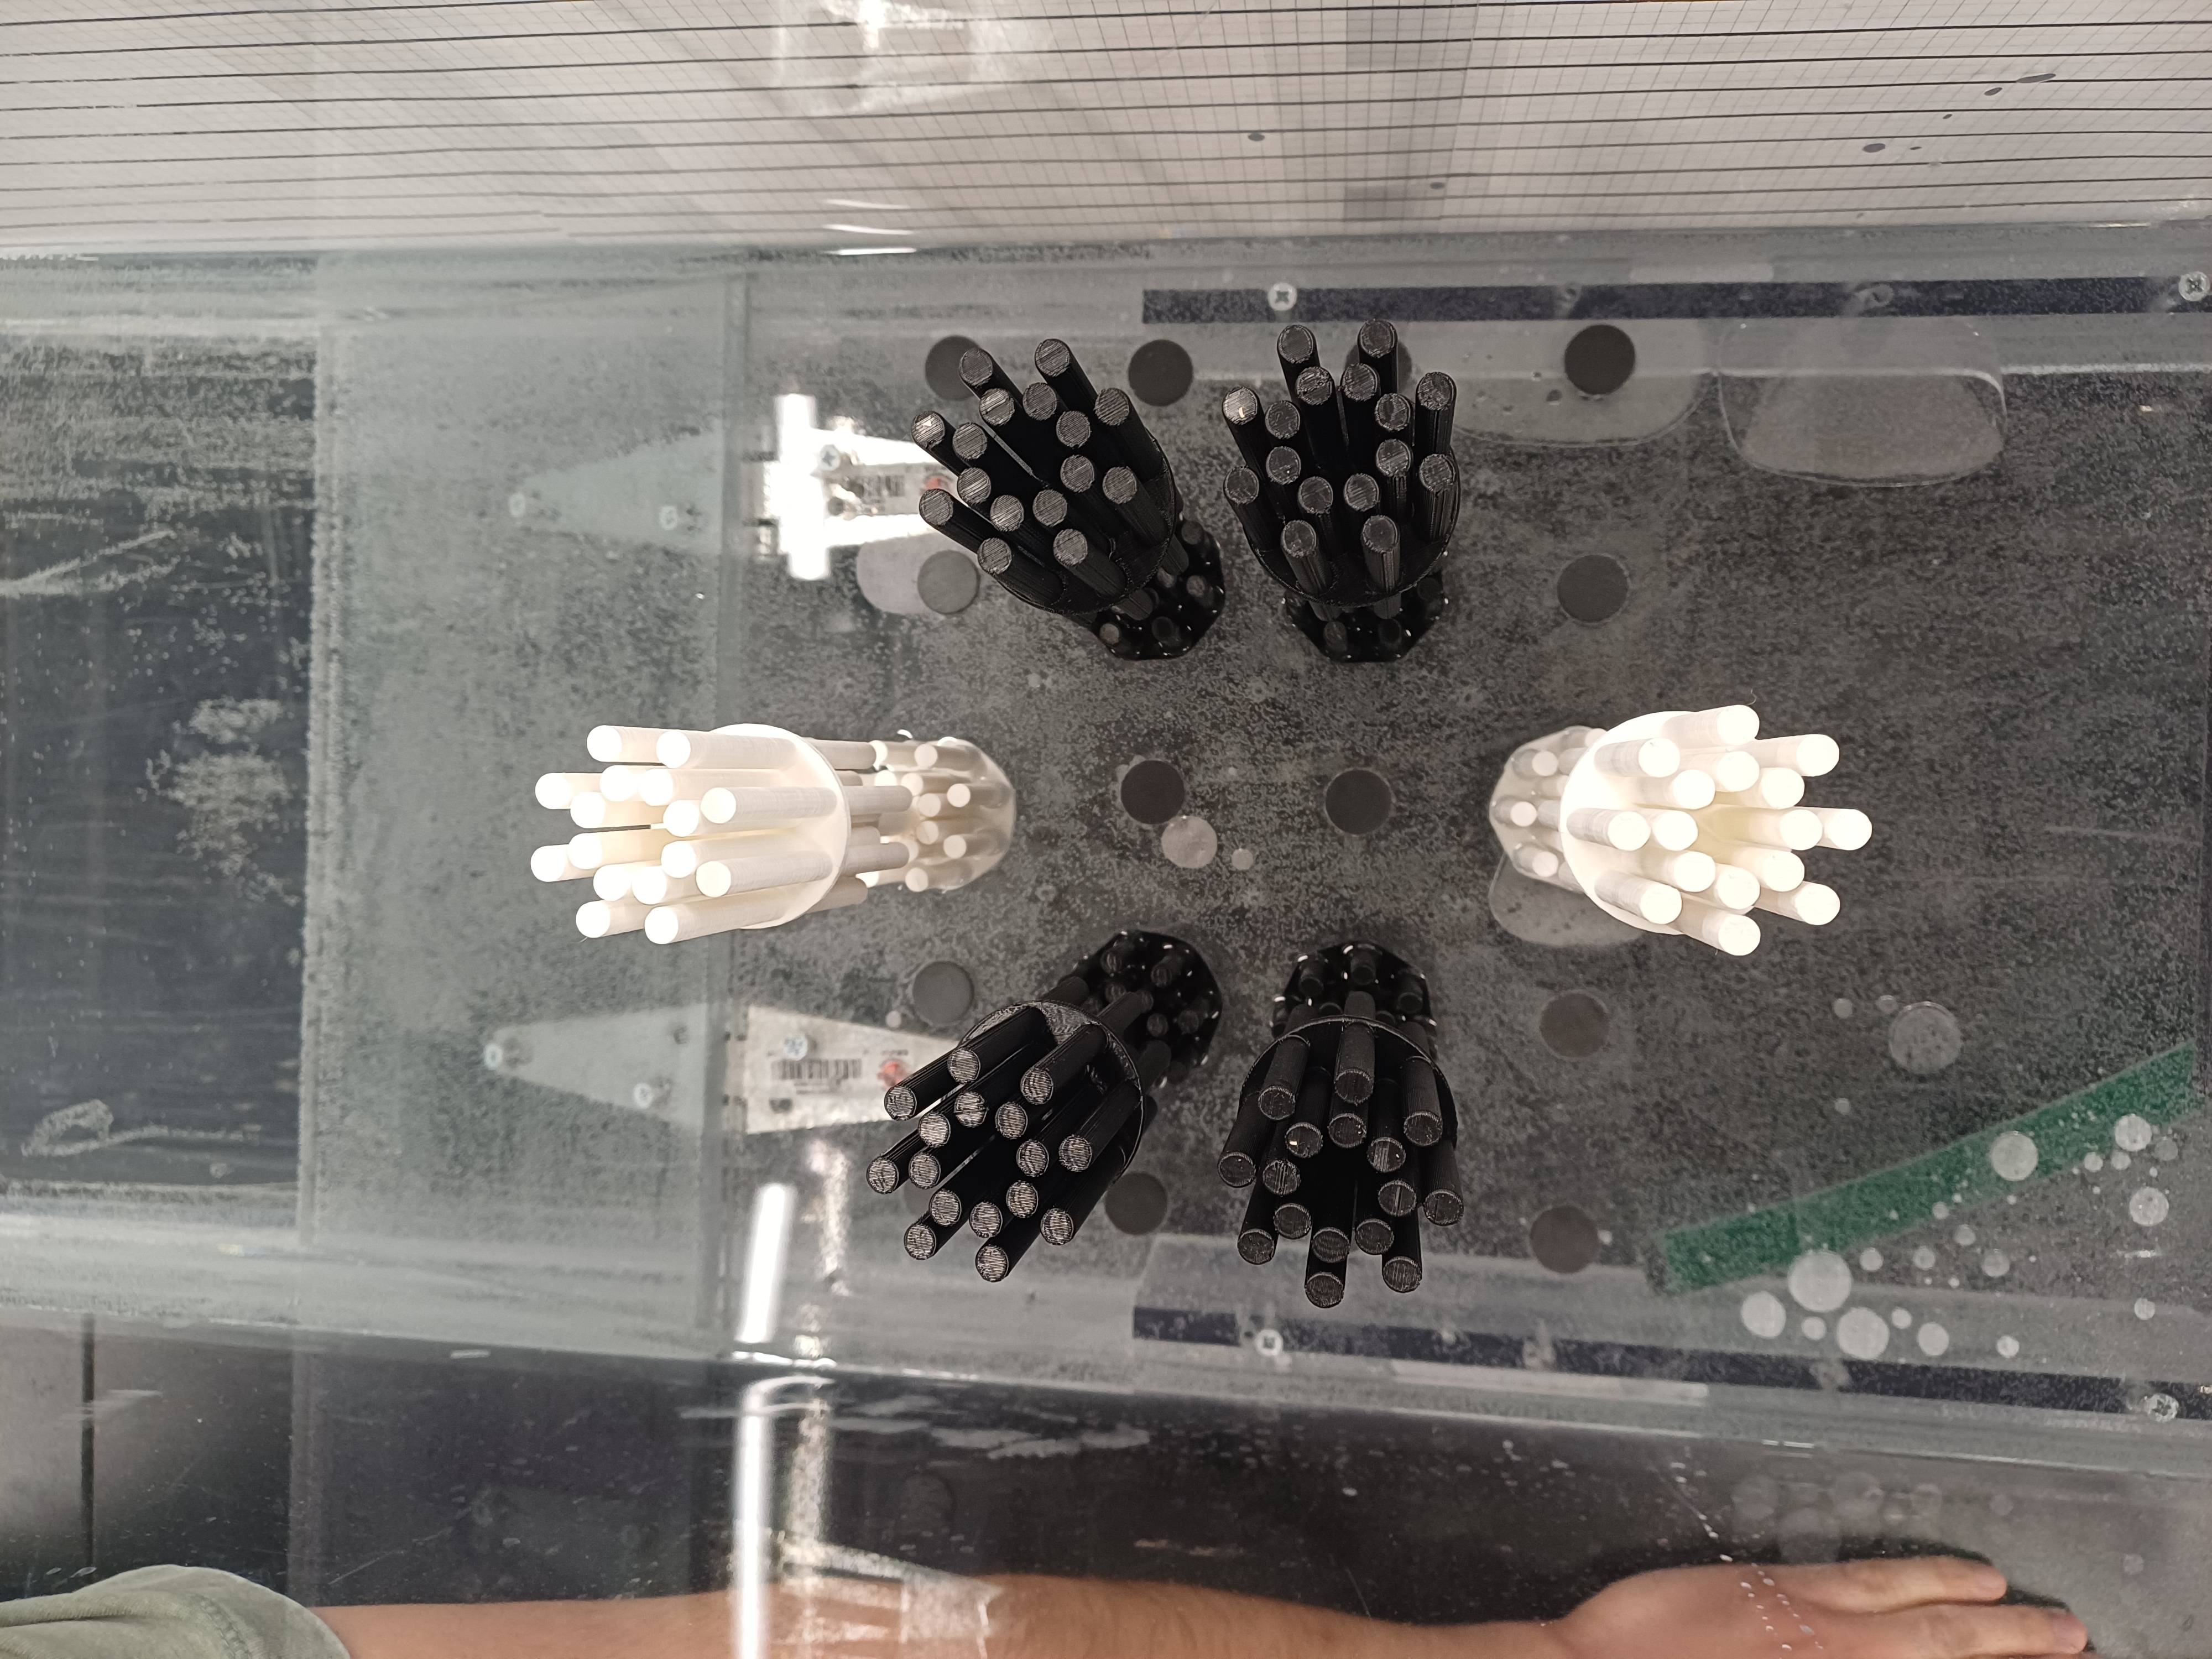
The mounting board let us reposition the models between tests. We tried several layouts and increased the number of trees to see how the measured wave heights changed.
The mangrove geometry came from a published study. We used the models to compare arrangements in our tank, rather than reproduce a full-scale coastal setting.
Measuring the waves
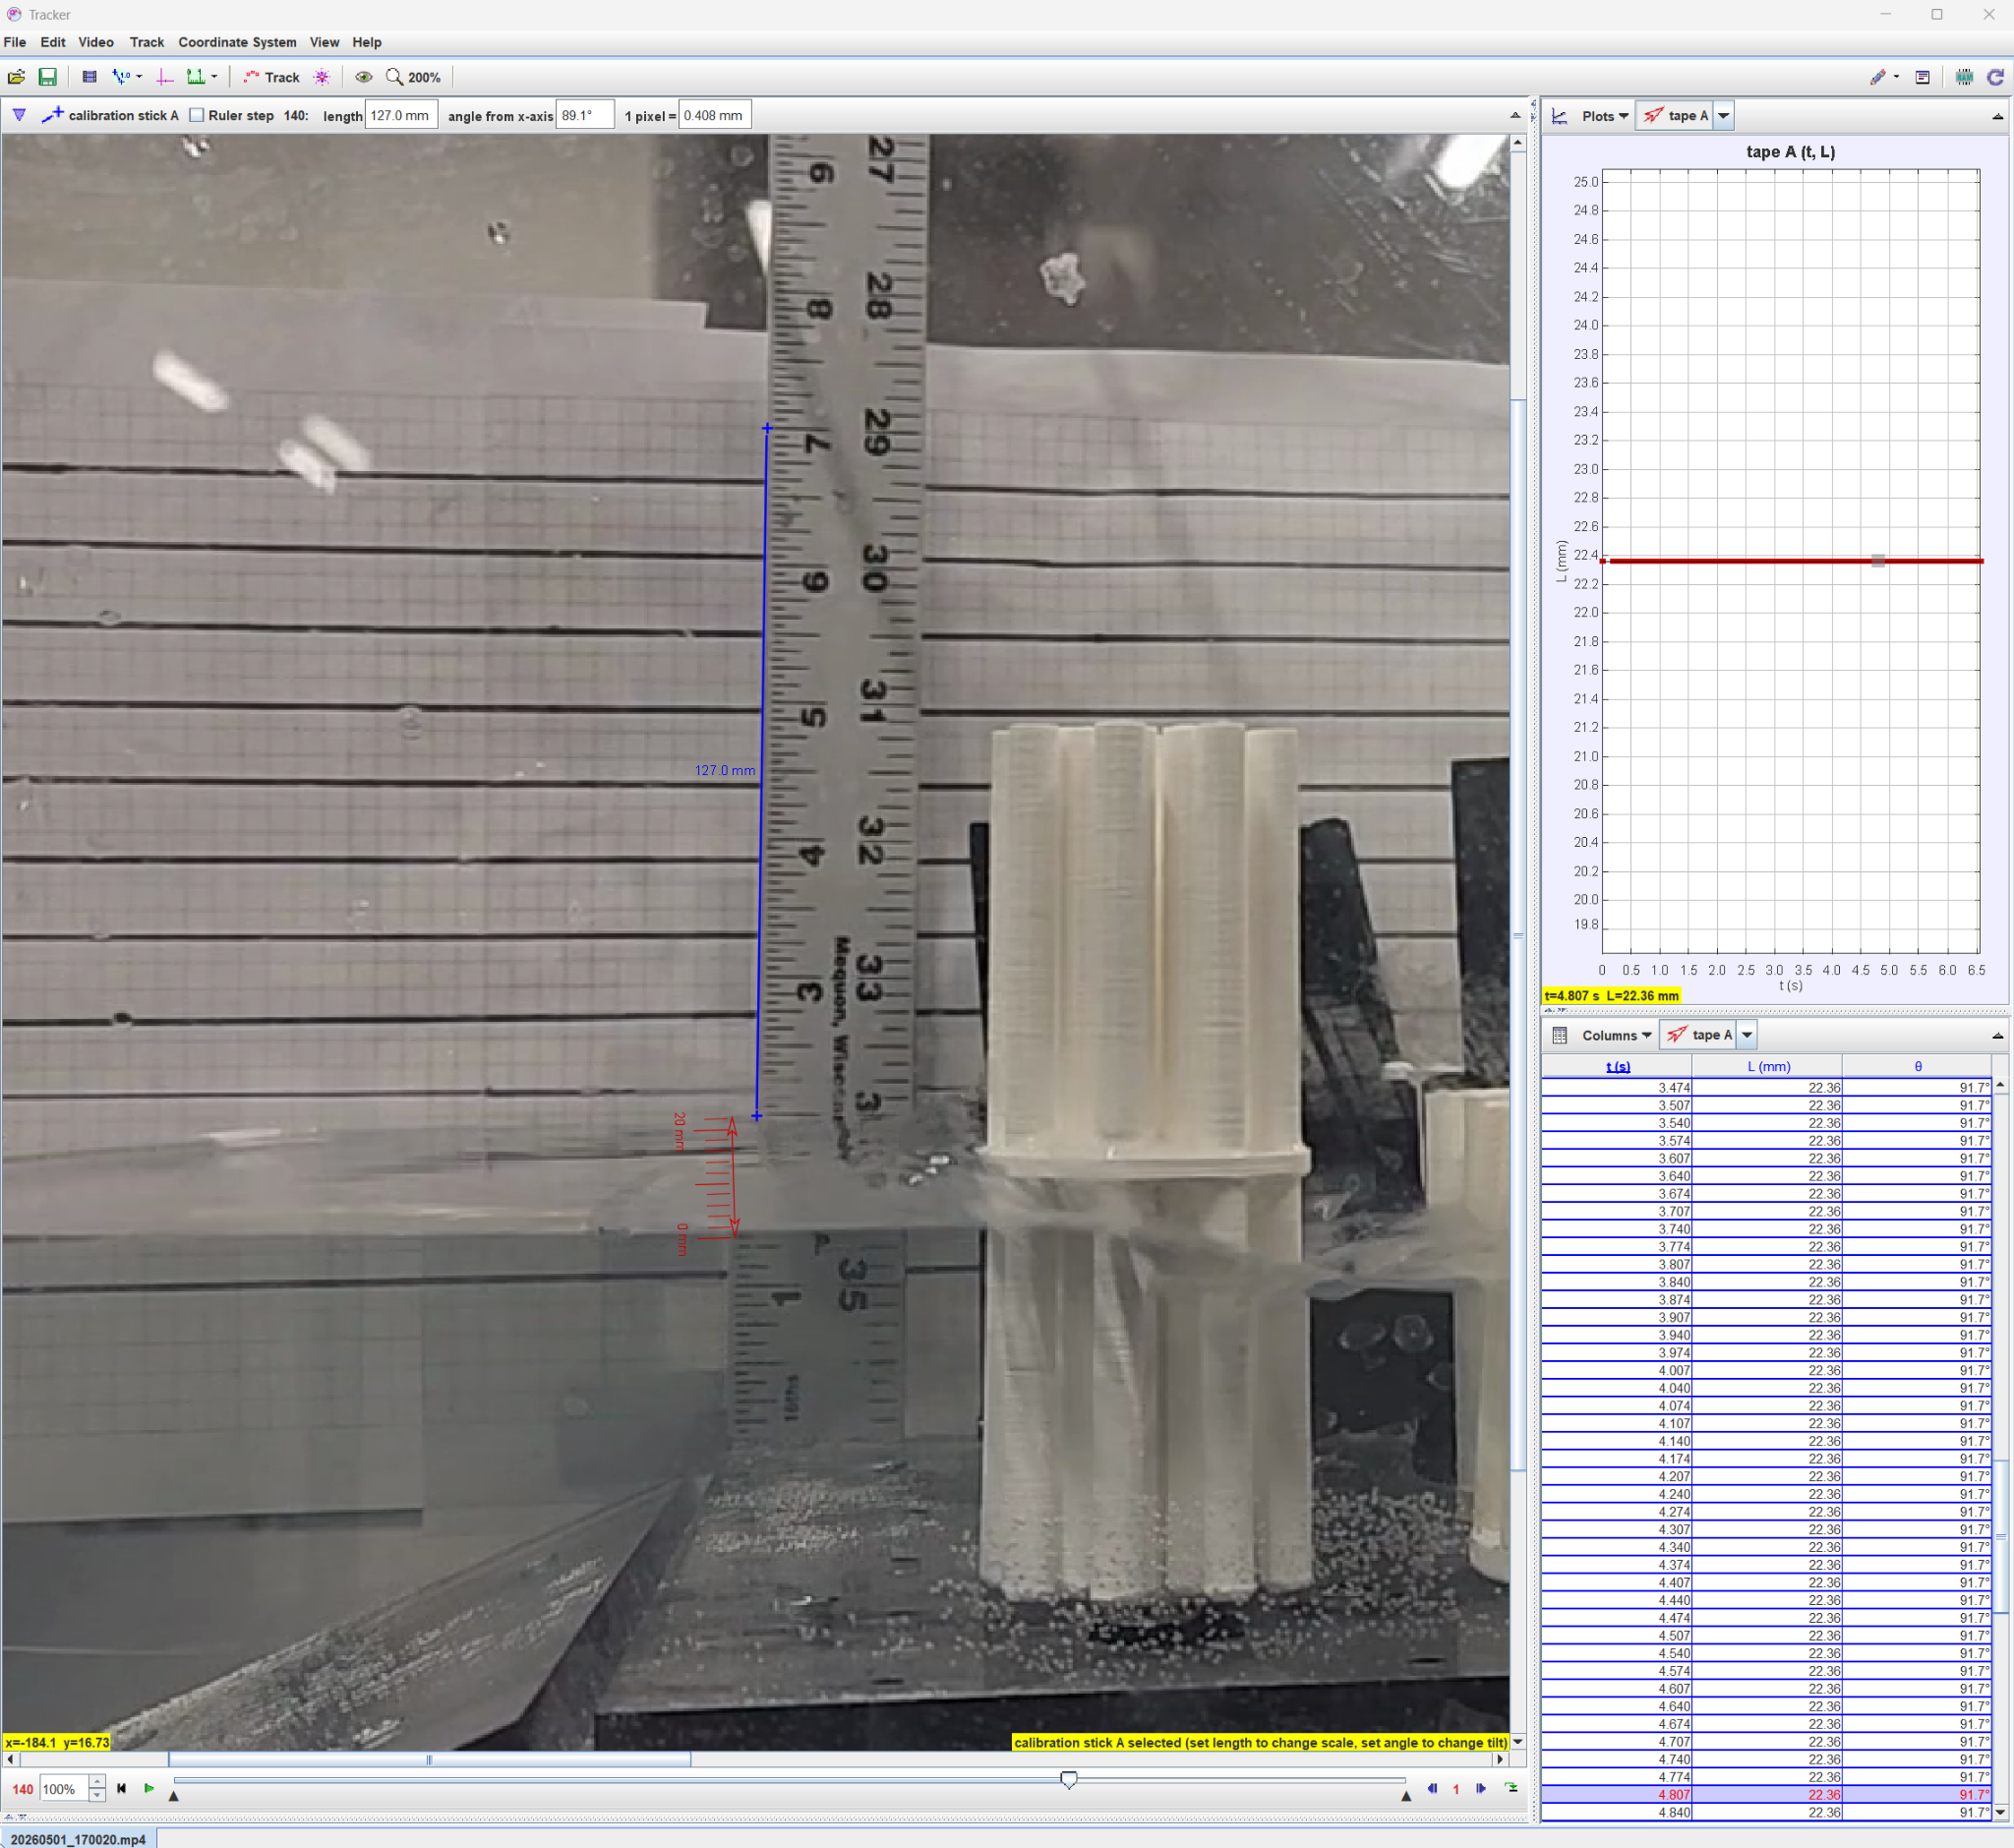
I used a known distance on the ruler to set the video scale in Tracker, then measured wave heights against the reference grid. This let me review individual frames instead of estimating the height while a test was running.
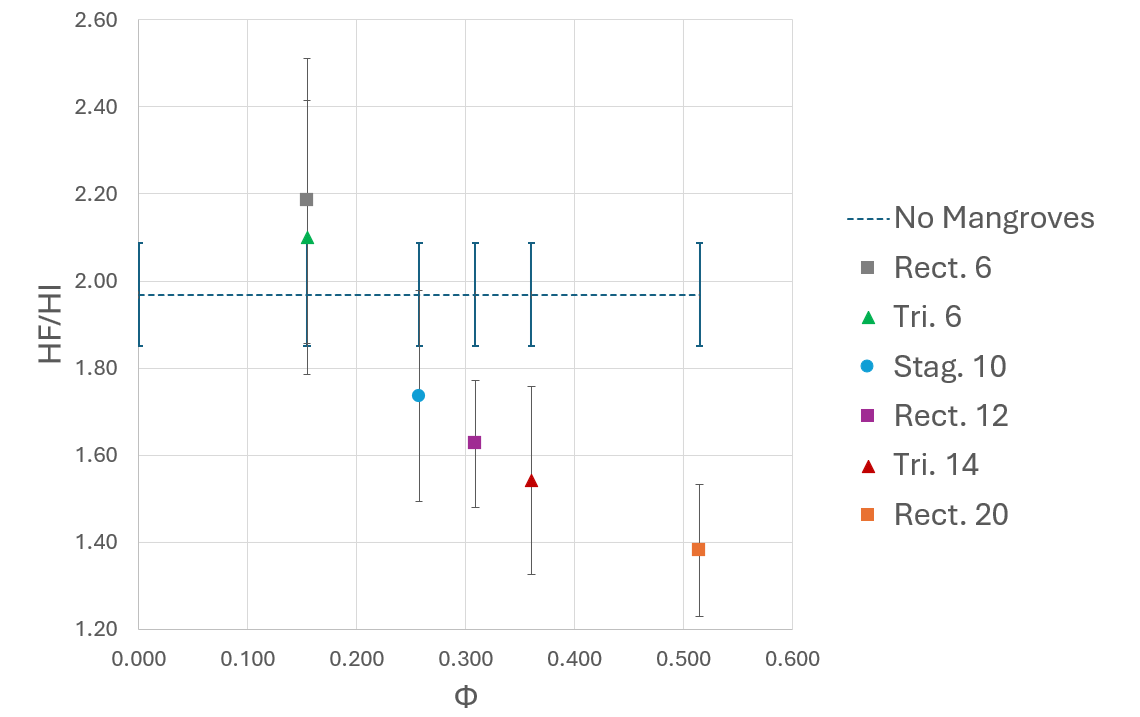
I analyzed the measurements in Excel and compared the final-to-initial wave-height ratios across trials. The ratios helped account for differences in the initial wave heights.
What we found
The six-tree layouts did not show a clear difference from the no-mangrove control within the measurement uncertainty. The tested arrangements with 12 to 20 trees had lower wave-height ratios.
About 30% below the control
The 20-tree rectangular arrangement had an average wave-height ratio of about 1.38, compared with 1.97 for the control. This was a reduction in the ratio relative to the control, not a 30% drop from the initial wave height.
A limit of the comparison
The arrangement also changed as we added more trees, so we could not separate the effect of density from the effect of layout. The results describe the configurations we tested.